
 Standard Deviation Calculator

Standard deviation (SD) measured the volatility or variability across a set of data. It is the measure of the spread of numbers in a data set from its mean value and can be represented using the sigma symbol (σ). The following algorithmic calculation tool makes it easy to quickly discover the mean, variance & SD of a data set.
Math Formulas
- Mean = sum of values / N (number of values in set)
- Variance = ((n1- Mean)2 + ... nn- Mean)2) / N-1 (number of values in set - 1)
- Standard Deviation σ = √Variance
- Population Standard Deviation = use N in the Variance denominator if you have the full data set. The reason 1 is subtracted from standard variance measures in the earlier formula is to widen the range to "correct" for the fact you are using only an incomplete sample of a broader data set.
Example Calculation
for data set 1,8,-4,9,6 compute the SD and the population SD.
SD Calculation
Sum:
1+8+-4+9+6=20
Mean:
20/5 numbers =
mean of 4
Variance:
((1-4)2 + (8-4)2 + (-4-4)2 + (9-4)2 + (6-4)2) / (N-1) =
((-3)2 +( 4)2 + (-8)2 + (5)2 + (2)2 ) / 4 =
(9+16+64+25+4)/4 =
118/4 = 29.5
Standard Deviation:
√29.5= 5.43139
Population SD Calculation
Population Standard Deviation Variance:
((1-4)2 + (8-4)2 + (-4-4)2 + (9-4)2 + (6-4)2) / N =
((-3)2 +( 4)2 + (-8)2 + (5)2 + (2)2 ) / 5 =
(9+16+64+25+4) / 5 =
118 / 5 = 23.6
Population Standard Deviation:
√23.6= 4.85798
Standard Deviation: What It Is, Importance, and Real-World Uses
- Guide Authored by Corin B. Arenas, published on October 10, 2019
Ever wondered how far the difference is between an excellent SAT score and a bad one? What about global economic inequality stats? How about the risk involved in making investments?
If you’re still asking these questions, you’ve come to the right place. In this section, you’ll learn how to determine standard deviation, why it’s important, and its practical uses in the real world.
What is Standard Deviation?

In statistics, standard deviation (SD) is a measure of how spread out numbers are in a given set, showing points of variation. It tells us to what degree a set of numbers are dispersed around an average.
The dispersion is the difference between the actual value and the average value in a set. Basically, the wider the dispersion, the higher the standard deviation.
Its value is represented by the Greek letter sigma (σ), showing how much of the data is spread around the mean (also referred to as the average).
SD can range from 0 to infinity. Getting a 0 indicates that a set of numbers are all equal, which signifies they don’t spread apart to any degree at all.
What is a Mean? It is the mathematical average of all numbers in a set represented by the Greek letter mu (µ). To calculate the mean, add up the values of all the numbers then divide it by the total number of values in a given set.
Mean = sum of all values / N (number of values in set)
What Does Standard Deviation Suggest?
- Low SD indicates that the numbers are close to the mean set.
- High SD signifies that the numbers are dispersed at a wider range.
To better understand SD, we should visualize how it translates into a graph. In particular, let’s discuss the normal distribution graph, otherwise known as the bell curve.
The Bell Curve and Deviations from the Mean

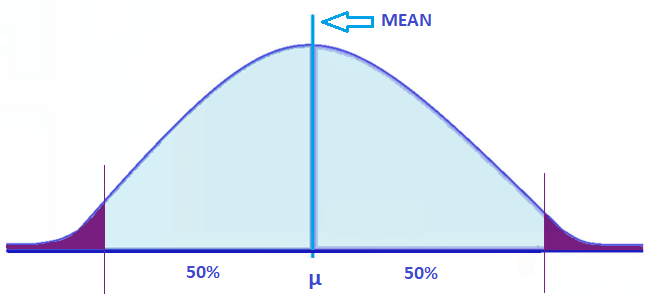
In a perfectly normal distribution, majority of the data points are relatively similar. It looks symmetrical, which means half of the data observations are on either side of the graph. It indicates that the data falls within a range of values with few outliers on the low or high points of the graph.
Elements of Normal Distribution:
- Has a mean, median, or mode. A mean is the average of numbers in a group, a median is the middle number in a list of numbers, and a mode is a number that appears most often in a set of numbers.
- 50% of the values are less than the mean
- 50% of the values are greater than the mean
A normal distribution curve is also a theoretical representation of how frequently an experiment will yield a particular result.
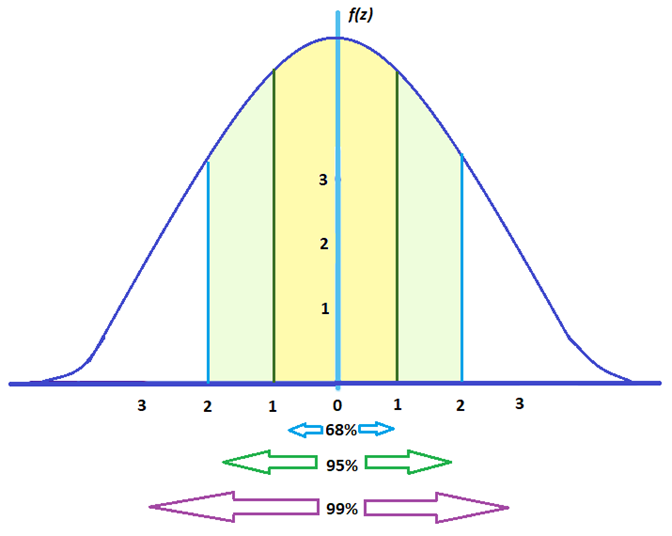
How does standard deviation look in a normal distribution graph? See example image below.
Each colored section represents 1 standard deviation from the mean. For instance, 1σ signifies 1 standard deviation away from the mean, and so on. Likewise, -1σ is also 1 standard deviation away from the mean, but in the opposite direction.
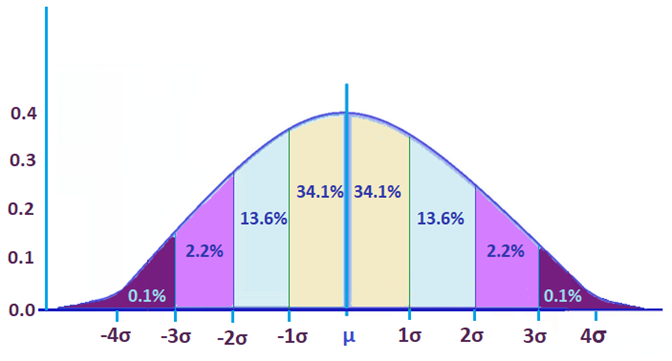
The percentages represent how much data falls within each section. In this example, 34.1% of the data occurs within a range of 1 standard deviation from the mean. Since it mirrors the other half of the graph, 34.1% of the data also occurs -1σ from the mean.
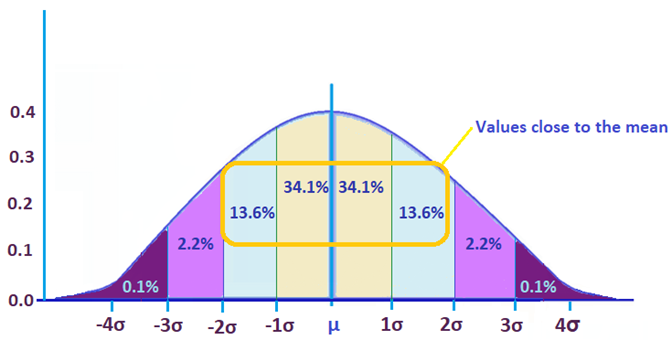
This graph above shows majority of the data, 95.5%, falls closer to the mean. This indicates it has low standard deviation.
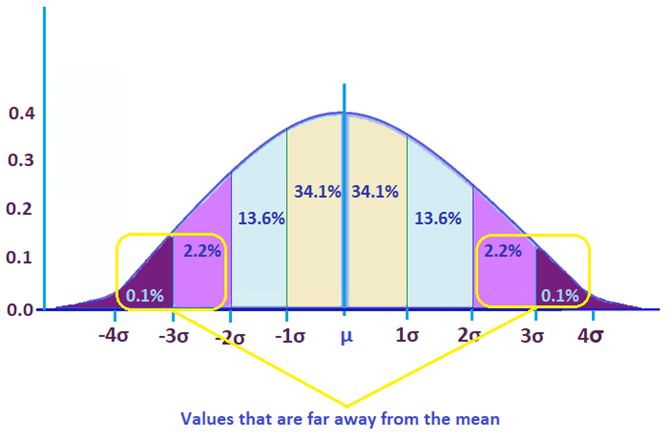
The graph above shows that only 4.6% of the data occurred after 2 standard deviations.
Moreover, data tends to occur in a typical range under a normal distribution graph:
- Around 68% fall between -1 and 1
- Around 95% fall between -2 and 2
- Around 99% fall between -3 and 3
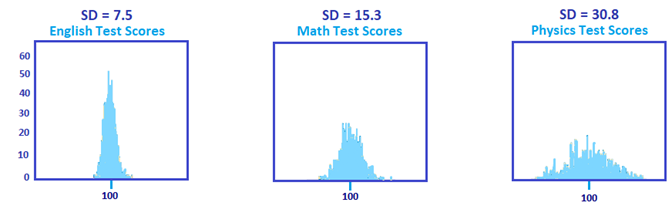
Standard Deviation in Histograms
Data can also be represented through a histogram, which demonstrates numbers using bars of different heights. In a histogram, bars group numbers into ranges. A taller bar indicates a higher range.
A wider histogram suggests larger standard deviation, while a narrower one indicates lower standard deviation. See the examples below.
For instance, the following images illustrate histogram orientation for observed test scores based on 800 students, with a mean score of 100.
- English Test Scores SD = 7.5
- Math Test Scores SD = 15.3
- Physics Test Scores SD = 30.8
Out of the three examples, physics test scores demonstrate the highest standard deviation.
Finding Standard Deviation

The basic formula for SD (population formula) is:
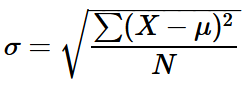
Where,
- σ is the standard deviation
- ∑ is the sum
- X is each value in the data set
- µ is the mean of all values in a data set
- N is the number of values in the data set
Basically, standard deviation is σ = √Variance
What is Variance? It is the average of the squared differences from the mean.
The standard formula for variance is:
V = ((n1– Mean)2 + … nn– Mean)2) / N-1 (number of values in set – 1)
How to find variance:
- Find the mean (get the average of the values).
- For each value, subtract the mean and square the result. This is the squared difference.
- Then find the average of the squared differences.
For instance, 5 friends just measured their height in centimeters. Using the example below, find the mean, variance, and standard deviation.
| Name | Height (cm) |
|---|---|
| Name | Height (cm) |
| Corin | 157.48 cm |
| Jen | 165.099 cm |
| Raffy | 172.72 cm |
| Jessie | 152.4 cm |
| Kat | 167.64 cm |
Mean = sum of all values / N (number of values in set)
Mean = 157.48 + 165.099 + 172.72 + 152.4 + 167.64 / 5
= 815.339 / 5
= 163.0678 cm
In this example, the mean or average height is 163.0678 cm.
To find the variance, get each difference from the mean, square it, and then find the average of the result.
- Corin: 163.0678 – 157.48 = 5.5878
- Jen: 163.0678 – 165.099 = -2.0312
- Raffy: 163.0678 – 172.72 = -9.6522
- Jessie: 163.0678 – 152.4 = 10.6678
- Kat: 163.0678 – 167.64 = -4.5722
σ2 = 5.58782 + (-2.0312)2 + (-9.6522)2 + 10.66782 + (-4.5722)2 / 5
= 31.22351 + 4.12577 + 93.16496 + 113.80196 + 20.90501 / 5
= 263.22121 / 5
= 52.644242
The variance is 52.644242. Since the standard deviation is the square root of the variance,
σ = √52.644242
= 7.2556352
The standard deviation in this example is 7.2556 cm.
If we plot it in a graph, we can now show which heights are within 1 standard deviation from the mean. Now that we know the ‘standard,’ we can determine what is the usual height, and what’s too short or too tall.

Based on this small set, Raffy is taller than the average person by over 1σ, at a height of 172.72 cm.
Of course, you can do it faster by using the calculator on top of this page.
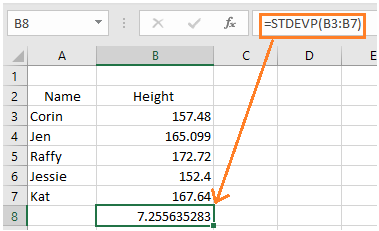
You can also use Excel, Google Sheets, or any similar program. This saves time if you’re finding standard deviation for a large set of numbers.
Just type in the formula =stdevp (), then select the numbers that you need to calculate. See the example below.
Significance and Real-World Uses

Finding standard deviation allows us to determine the normal or average range for anything that concerns a set of data. It’s widely used in social science research for analyzing records such as test scores, health and disease statistics, as well as data that shows patterns of cultural behavior.
In analyzing opinion surveys like election or consumer preferences, standard deviations are crucial in calculating margins of error. While it measures the consistency of a statistical hypothesis, it can also be tested for accuracy. This helps researchers determine normal patterns of behavior to come up with close predictions.
In finance, standard deviation of price or data measures volatility in investments such as individual securities, investment funds, and portfolios.
For instance, stock markets usually have high volatility (high SD), while bond markets demonstrate low volatility (low SD).
Moreover, one of the most significant figures in portfolio management is the Sharpe Ratio, named after Nobel prize winner and economist William Sharpe.
The Sharpe Ratio uses SD to measure risk-adjusted returns, which indicates the return of an investment by measuring the amount of risk involved in producing that return.
The Bottom Line
Standard deviation (SD) is an important tool for analyzing statistical data. It provides researchers with an estimate of the mean, which is the normal range, allowing them to set standards.
SD is used in a wide field of social science studies, including medicine, education, government, and cultural research. In finance, SD measures volatility when it comes to analyzing stock markets.
It’s a practical tool that allows researchers to measure the reliability of statistical hypothesis, as well as help predict future outcomes.
About the Author
Corin is an ardent researcher and writer of financial topics—studying economic trends, how they affect populations, as well as how to help consumers make wiser financial decisions. Her other feature articles can be read on Inquirer.net and Manileno.com. She holds a Master’s degree in Creative Writing from the University of the Philippines, one of the top academic institutions in the world, and a Bachelor’s in Communication Arts from Miriam College.
Are You Positive? Cartoon
Play & Learn